01 / Case study

PARO Live OEE

Independent open-source manufacturing analytics project

A read-only OEE and downtime visibility demo driven by deterministic synthetic 15-minute data.

Status
Published
Evidence
Aug 20, 2026
Stack
Python 3.14 · FastAPI · PostgreSQL · Power BI · GitHub Actions

Evidence as of Aug 20, 2026 · source 9ad5798 (opens in a new tab)

02

Executive summary

When OEE and downtime are assembled after the shift, loss visibility arrives too late and the number can become detached from the events that produced it.

PARO tests a bounded alternative: one audited calculation path, recent synthetic facts, explicit freshness, and a read-only decision surface that never pretends to be an MES or sensor feed.

My scope

Designed and built the OEE domain engine, FastAPI application service, persistence contracts, protected rolling simulator, read-only web dashboard, Power BI Import model, tests, and deployment gates.

03

What I built

  1. 01

    Protect every write with an API key while keeping the trusted-ingest token limited to rate-limit exemption.

  2. 02

    Regenerate deterministic production days with absolute IDs, then send only missing closed buckets and close open downtime events optimistically.

  3. 03

    Load persisted facts through an application service that invokes the Decimal-based domain OEE function exactly once.

  4. 04

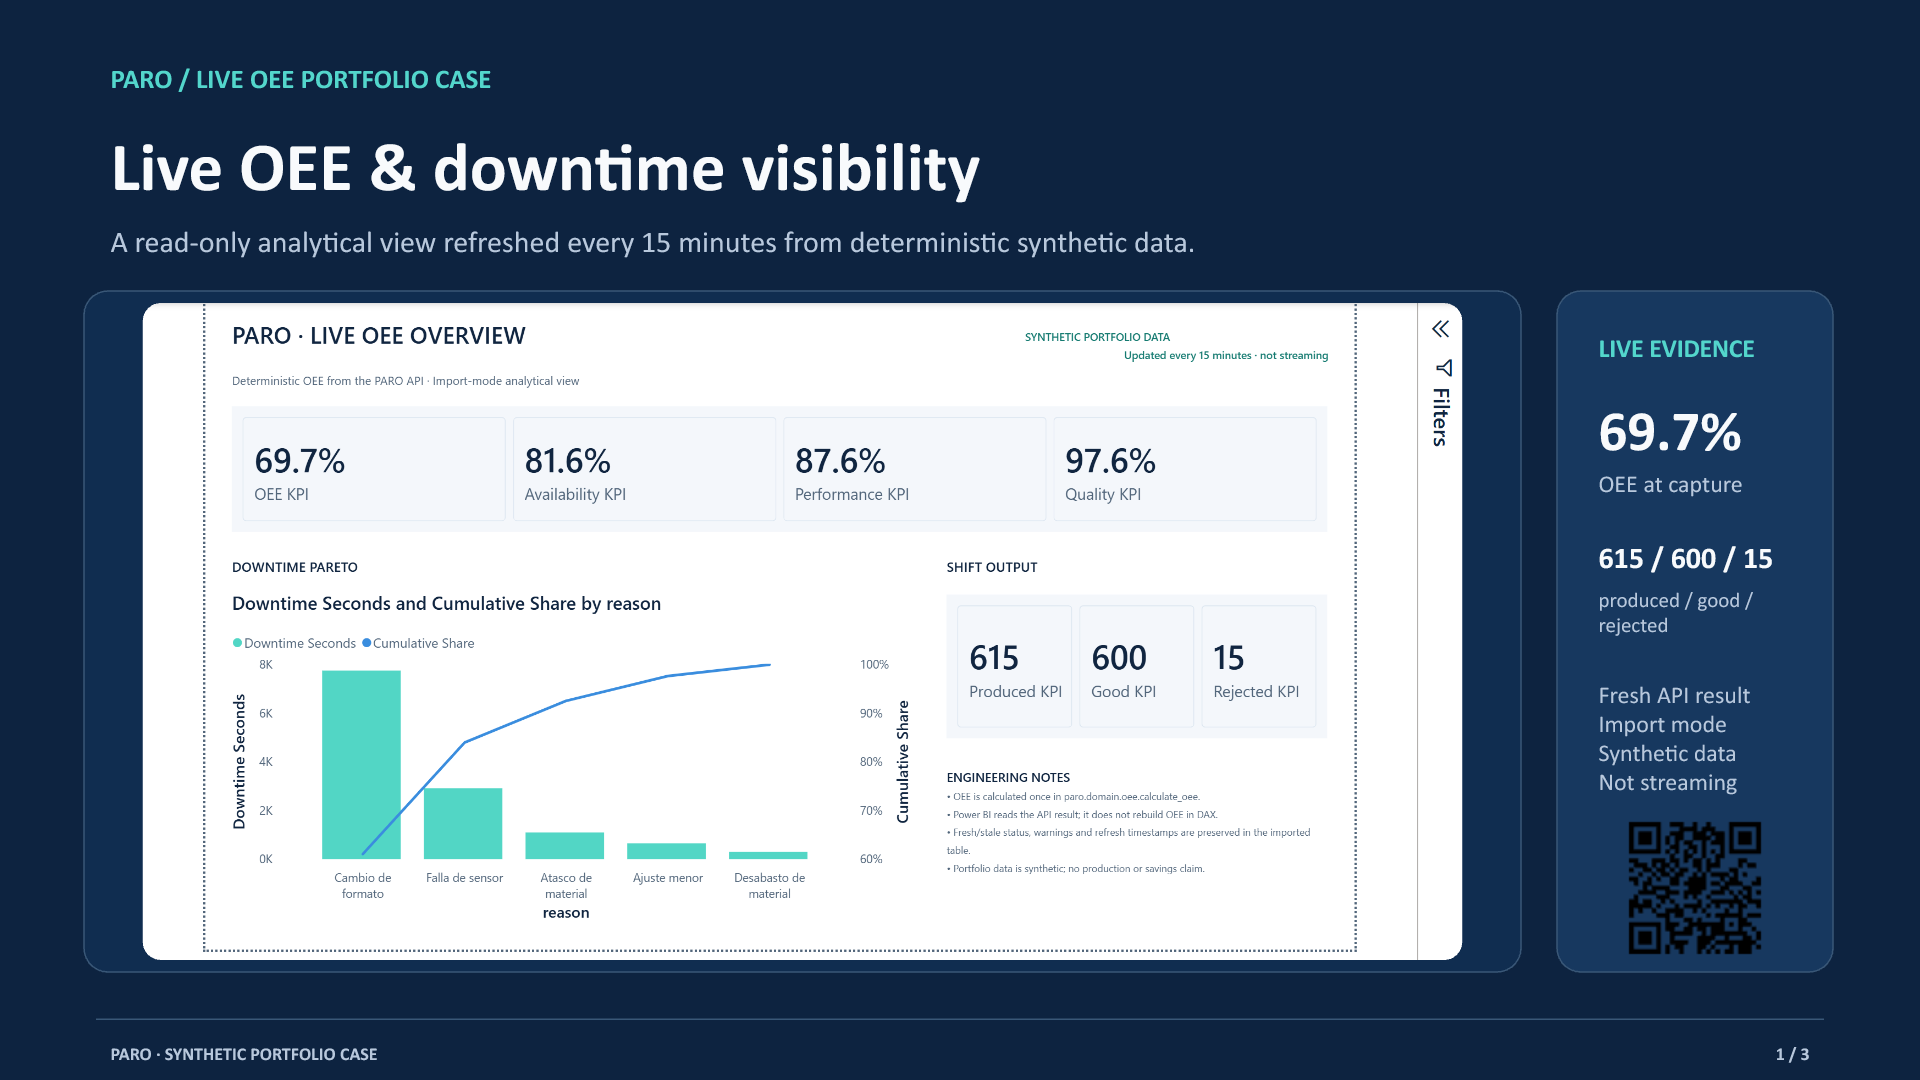
    Expose freshness, OEE components, output, warnings, and a downtime Pareto through a read-only API and web dashboard.

  5. 05

    Prepare a Power BI Import model that consumes API results without rebuilding OEE in DAX.

04

Architecture and data flow

Each stage keeps one concern explicit: authenticated writes, a single calculation path, transactional persistence, decision-facing views, and independent deployment gates.

  1. 01

    Authenticated ingest

    Production and downtime writes require an API key; trusted ingest remains an independent rate-limit concern.

  2. 02

    Application service

    A read service gathers line facts and calls paro.domain.oee.calculate_oee exactly once.

  3. 03

    PostgreSQL

    Request-scoped transactions, idempotency keys, and optimistic event closure preserve traceability without claiming batch atomicity.

  4. 04

    Decision views

    The web dashboard polls every 60 seconds; synthetic source facts advance on a 15-minute cadence. Power BI is Import mode.

05

Evidence and verification

  • The complete local suite contains 208 tests, including crossed credential combinations, secret-log canaries, readiness/liveness behavior, deterministic replay, non-colliding days, open-event closure, and 48-hour catch-up.
  • A full synthetic production day stays inside the configured 70–80% OEE band after correcting the serial-line counting model; the dashboard uses the same domain result.
  • The PBIR structural validator reports zero errors. Power BI Desktop refreshed successfully and the final evidence uses the authentic Desktop capture.

06

Decision-facing evidence

Every number carries its model, evidence state, and boundary.

15 min

synthetic feed cadence

Represents
The rolling driver materializes the latest closed quarter-hour, not a streaming sensor event.
Why it matters
The dashboard can expose data-through and fresh/stale state without overstating immediacy.
Does not show
It does not demonstrate real-time MES integration or sensor latency.

48 h

bounded catch-up

Represents
A missed cron run can reconcile recent deterministic IDs without unbounded replay.
Why it matters
Recovery cost remains bounded and a larger outage becomes an explicit gap.
Does not show
It is not a promise of global batch atomicity or zero data loss.

208

local automated tests

Represents
The complete test collection at the pinned evidence commit.
Why it matters
It exercises calculation, persistence, API, auth, simulator, and presentation contracts.
Does not show
A passing local suite is not production uptime or industrial validation.

22.1%

illustrative base ROI

Represents
A sensitivity case using explicit assumptions: $3,500 implementation, $600 annual operations, and $5,005 modeled reporting-time benefit.
Why it matters
The model can be replaced with client-approved cadence, time, rate, and realization inputs.
Does not show
It is not achieved savings or a forecast; downtime and scrap benefits remain $0.

07

Honest limits

  • All displayed manufacturing data is synthetic portfolio data; no client, plant, or production result is represented.
  • The feed advances every 15 minutes and the page polls every 60 seconds. It is not streaming, real-time sensors, or MES connectivity.
  • Render write authentication and the 15-minute cron were active at verification; clients receive no write credentials.
  • Power BI uses Import mode and shows a verified point-in-time refresh; it is not a streaming surface.
  • ROI values are illustrative sensitivity scenarios, not savings claims. Avoided downtime and scrap are assigned zero benefit.

08

Source and provenance

All public statements on this page are bounded by the pinned implementation commit and the documented verification limits.

View full provenance
Evidence date
2026-08-20
Documents consulted
  • README.md
  • docs/adr/0004-simulator-multi-agent-architecture.md
  • docs/deployment.md
  • docs/oee-definition.md
  • docs/roi-model.md
  • docs/upwork-portfolio.md
  • PowerBi/README.md
Licensing
Project-authored code, documentation, dashboard assets, and synthetic data are published under the repository's MIT license.