01 / Case study

DMAIC PCBA Case

Independent DMAIC technical case with illustrative data

An illustrative Lean Six Sigma case connecting MSA, capability, ANOVA, factorial DOE, financial modeling, and a bounded control roadmap.

Status
Published
Evidence
Aug 20, 2026
Stack
Minitab · Gage R&R · ANOVA · DOE · PFMEA

Evidence package as of Aug 20, 2026 · source report PDF (opens in a new tab)

02

Executive summary

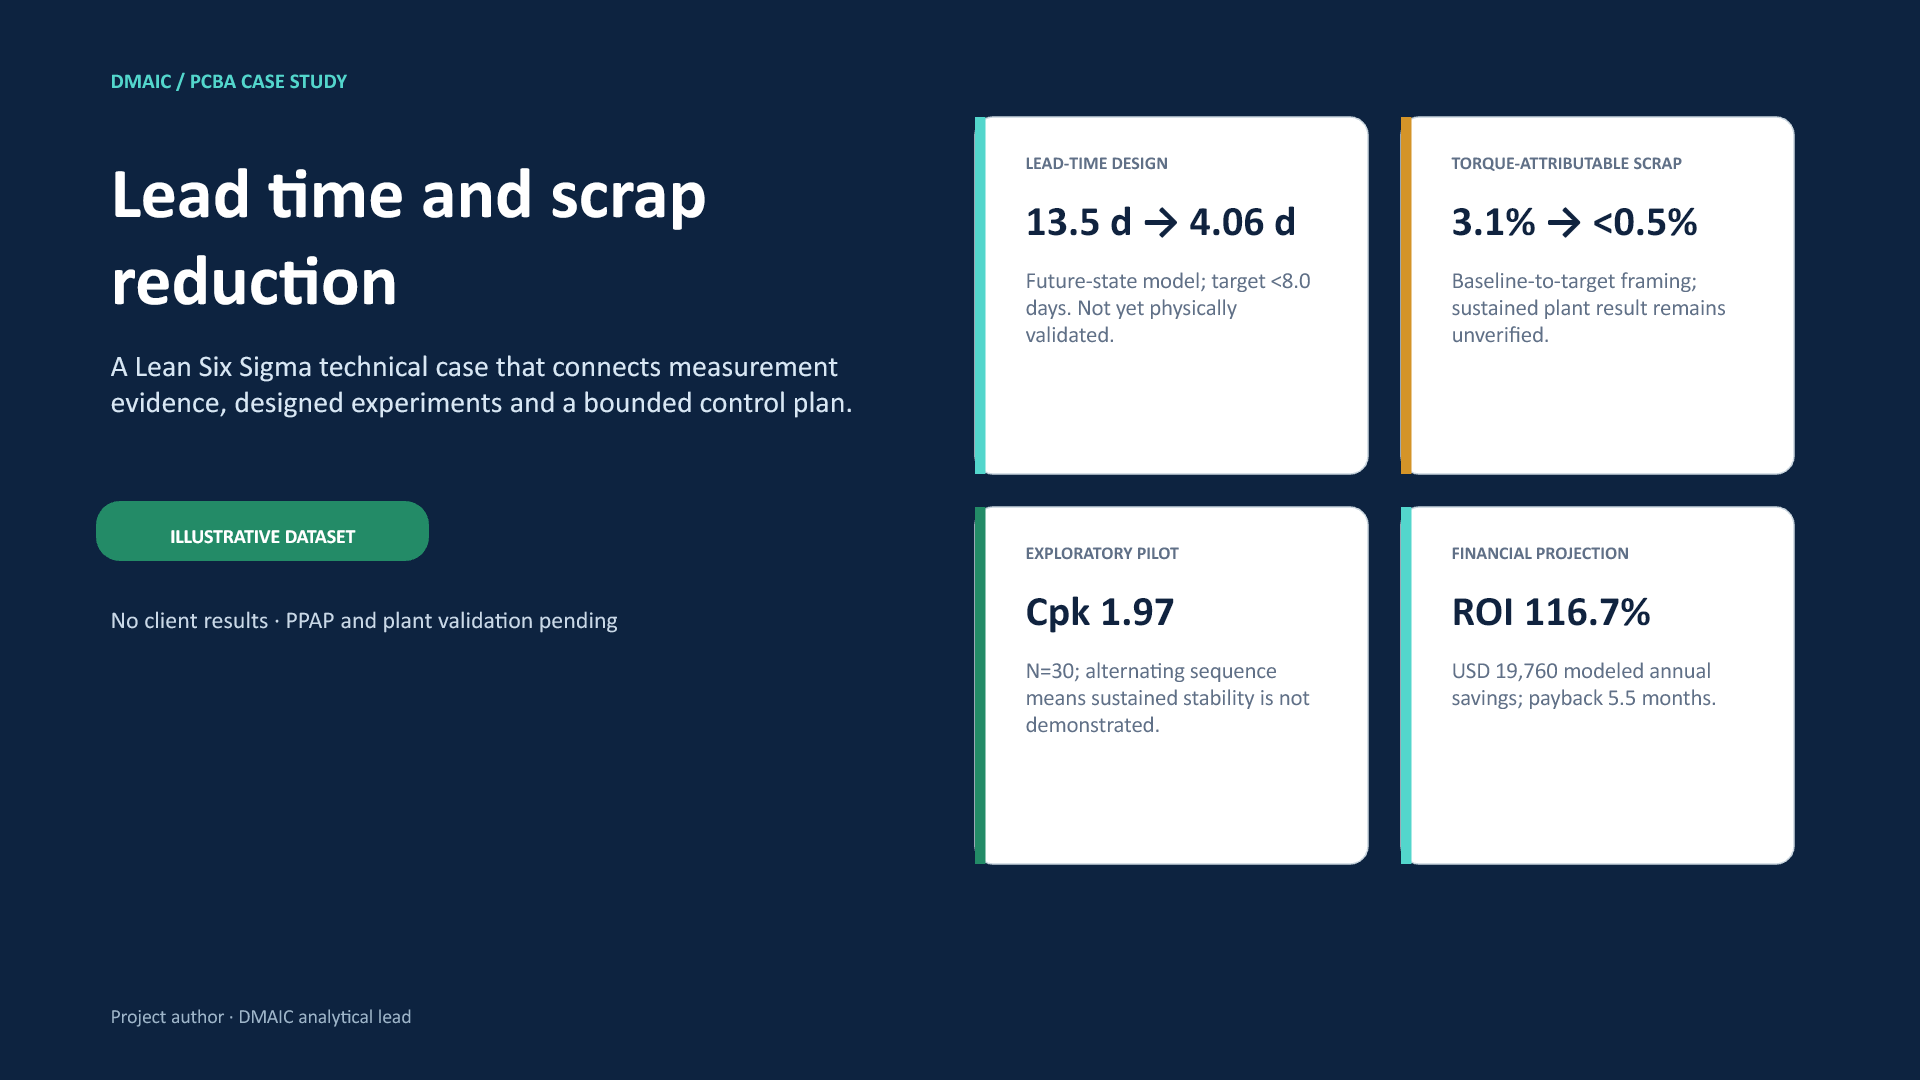
The illustrative PCBA assembly scenario begins with 13.5 days of lead time, 5.0% total scrap, and 3.1% scrap attributed to high torque.

The case tests whether measurement evidence and designed experiments can narrow the improvement hypothesis before any plant release or savings claim.

My scope

Authored the DMAIC case and its analytical evidence: charter, VSM, MSA, capability, ANOVA, 2² factorial DOE, response optimization, PFMEA, Control Plan, financial model, and sustainment roadmap.

03

What I built

  1. 01

    Frame the business problem through a charter, CTQs, a current-state VSM, and explicit projected financial assumptions.

  2. 02

    Qualify the torque measurement system, quantify the baseline capability gap, and separate sample evidence from the annual financial baseline.

  3. 03

    Use ANOVA and a 2² factorial DOE to test factors, inspect diagnostics, and propose a centered operating condition.

  4. 04

    Treat the 30-piece pilot as exploratory evidence and carry unresolved stability, PPAP, finance, and plant-validation gates into Control.

04

Architecture and data flow

The workflow advances only when the evidence supports the next gate—from measurement adequacy to factor analysis, pilot evidence, and controlled transfer.

  1. 01

    Define

    Charter, VOC/CTQ, scope, VSM, timeline, and projected COPQ frame the decision.

  2. 02

    Measure

    Pareto, Gage R&R, normality, and baseline capability establish the measurement and performance evidence.

  3. 03

    Analyze + Improve

    ANOVA, factorial DOE, diagnostics, and response optimization narrow a proposed operating condition.

  4. 04

    Control

    Exploratory pilot evidence feeds PFMEA, Control Plan, training, transfer, and a 30/60/90 validation path.

05

Phase evidence and release gates

  • The illustrative defect sample contains 100 observations; Torque Alto represents 62% of that sample. This denominator is not interchangeable with the 3.1% annual attribution used in the financial model.
  • Gage R&R reports 3.37% total GRR. Baseline capability reports mean 15.4 lb-in, Cp 1.12, Cpk 0.67, and Anderson–Darling p=0.0152.
  • ANOVA identifies tool speed at p<0.001 with R²=66.93%. The factorial DOE and response optimizer support a proposed Low Speed / 85 psi setup with fitted torque 15.000 lb-in.
  • The 30-piece pilot reports mean 15.008 lb-in, Cpk 1.97, and Ppk 2.92, but lag-1 autocorrelation near −0.736 prevents a sustained-stability claim.

06

Decision-facing evidence

Every metric states what it supports—and what remains unverified.

62%

Torque Alto share

Represents
Its share of the 100-observation illustrative defect sample.
Why it matters
It prioritizes torque as the critical quality focus for deeper analysis.
Does not show
It does not prove plant-wide causality or equal the annual 3.1% attribution.

Cpk 0.67

baseline capability

Represents
Normal-model capability for the illustrative n=100 torque sample.
Why it matters
The centered specification is not met at baseline.
Does not show
Normality is rejected at p=0.0152, so the model understates the observed tail problem.

Cpk 1.97

exploratory pilot

Represents
The 30-piece illustrative pilot under the proposed setup.
Why it matters
The mean aligns closely with the 15.000 lb-in model prediction.
Does not show
Alternation and r₁≈−0.736 mean sustained production stability is not demonstrated.

116.7%

projected ROI

Represents
USD 19,760 modeled annual savings against USD 9,120 investment.
Why it matters
It makes the financial assumptions inspectable before approval.
Does not show
It is not realized savings; Finance validation and plant execution remain pending.

07

Honest limits

  • The complete case uses an illustrative dataset. No client, production, or certified plant result is claimed.
  • Lead time 4.06 days and scrap below 0.5% are design targets, not achieved operating results.
  • The proposed Low Speed / 85 psi setting requires confirmation in natural production order across shifts, lots, operators, and real conditions.
  • The pilot capability indices remain exploratory until independence, stability, larger-sample evidence, and PPAP are complete.
  • ROI and payback are projections from stated assumptions; Finance sign-off is pending.

08

Source and provenance

The public case is bounded by the 38-page technical report and its SHA-256 fingerprint.

View full provenance
Evidence date
2026-08-20
Documents consulted
  • Proyecto DMAIC FINAL.pdf — 38 pages
Licensing
Project-authored portfolio evidence. No external-data or open-source license claim is made for the report.